
Dashboard & BI Tools
Data analytics is the process of collecting, transforming, and organizing data in order to draw conclusions, make predictions, and drive informed decision-making.
Modern data analytics goes beyond simple reporting—it enables businesses to uncover hidden patterns, predict future trends, and optimize performance across all operational areas. By transforming raw data into actionable insights, companies can make evidence-based decisions that drive growth, reduce costs, and enhance customer satisfaction.

Case Study:
Wisdom Bookstore Analytics Transformation
To demonstrate the power of systematic data analytics, we present Wisdom Bookstore, a multi-channel book retailer operating across Thailand since 2019. This simulated case study showcases the 5-step methodology applied to business challenges and data.
Business Context & Challenges:
Wisdom Bookstore, a multi-channel book retailer operating across Thailand since 2019, has experienced significant growth but faces challenges in data-driven decision making. It operates through 12 sales channels (6 online, 6 offline) with 360 SKUs across 6 product categories, generating ฿841.8K monthly revenue. The company faced challenges in inventory optimization, customer retention, and sales team performance management.
Click the dashboard image below to open the link in a new tab.

Our Approach:
5 Steps Analytics Methodology
Step 1: Define the Question/Objective
Original Challenge: "We need to improve our business performance and make better decisions"
Transformed into SMART Objectives:"Increase monthly revenue from ฿841.8K to ฿1.0M (18.8% growth) by optimizing inventory turnover from 0.08 to 0.15 turns annually and improving customer retention from 42% to 55% at 6 months, to be achieved by December 2024"
SMART Breakdown:
Specific: Target revenue increase through inventory and customer optimization
Measurable: ฿841.8K → ฿1.0M revenue, 0.08 → 0.15 inventory turns, 42% → 55% retention
Achievable: Based on industry benchmarks and current performance gaps
Relevant: Addresses core business challenges of working capital and customer value
Time-bound: December 2024 deadline with monthly progress tracking
Supporting Business Questions:
Sales Performance: "How can we achieve consistent 15% monthly growth while maintaining profitability?"
Inventory Management: "What is the optimal stock level for each SKU to minimize stock-outs (currently 12%) while reducing working capital?"
Customer Intelligence: "How do we increase customer lifetime value from ฿2,847 to ฿3,700 through better segmentation?"
Sales Team Optimization: "How do we reduce the 4.3:1 performance gap between our top and bottom sales representatives?"
Category Strategy: "Which product categories should we prioritize given Business & Economics is growing at +16.6% while Comics & Manga is declining -12.3%?".
Step 2: Collect Data
Suppose the Widsom Bookstore’s data ecosystem is as follows.
[1] Transactional Data Sources:
POS Systems: 6 physical store locations generating daily sales transactions
E-commerce Platforms: Shopify (Official Website), Lazada, Shopee, TikTok Shop, LINE Shopping, Facebook Shop
Sales Records: 136,761 transaction lines across 77,459 unique invoices (2019-2024)
[2] Customer Data Sources:
CRM System: 5,000 customer profiles with demographics and purchase history
Loyalty Programs: Customer segmentation data (VIP, Gold, Silver, Bronze, New)
Anonymous Transactions: 30% of sales from unidentified customers (opportunity for improvement)
[3] Operational Data Sources:
Inventory Management: 8,485 purchase records from 6 suppliers
Product Catalog: 360 SKUs across 6 main categories, 30 subcategories
Sales Team Performance: 20 sales representatives across multiple locations
[4] External Data Sources:
Market Trends: Book industry growth rates and seasonal patterns
Supplier Information: 6 key suppliers with performance metrics
Economic Indicators: Thai economic data affecting consumer spending
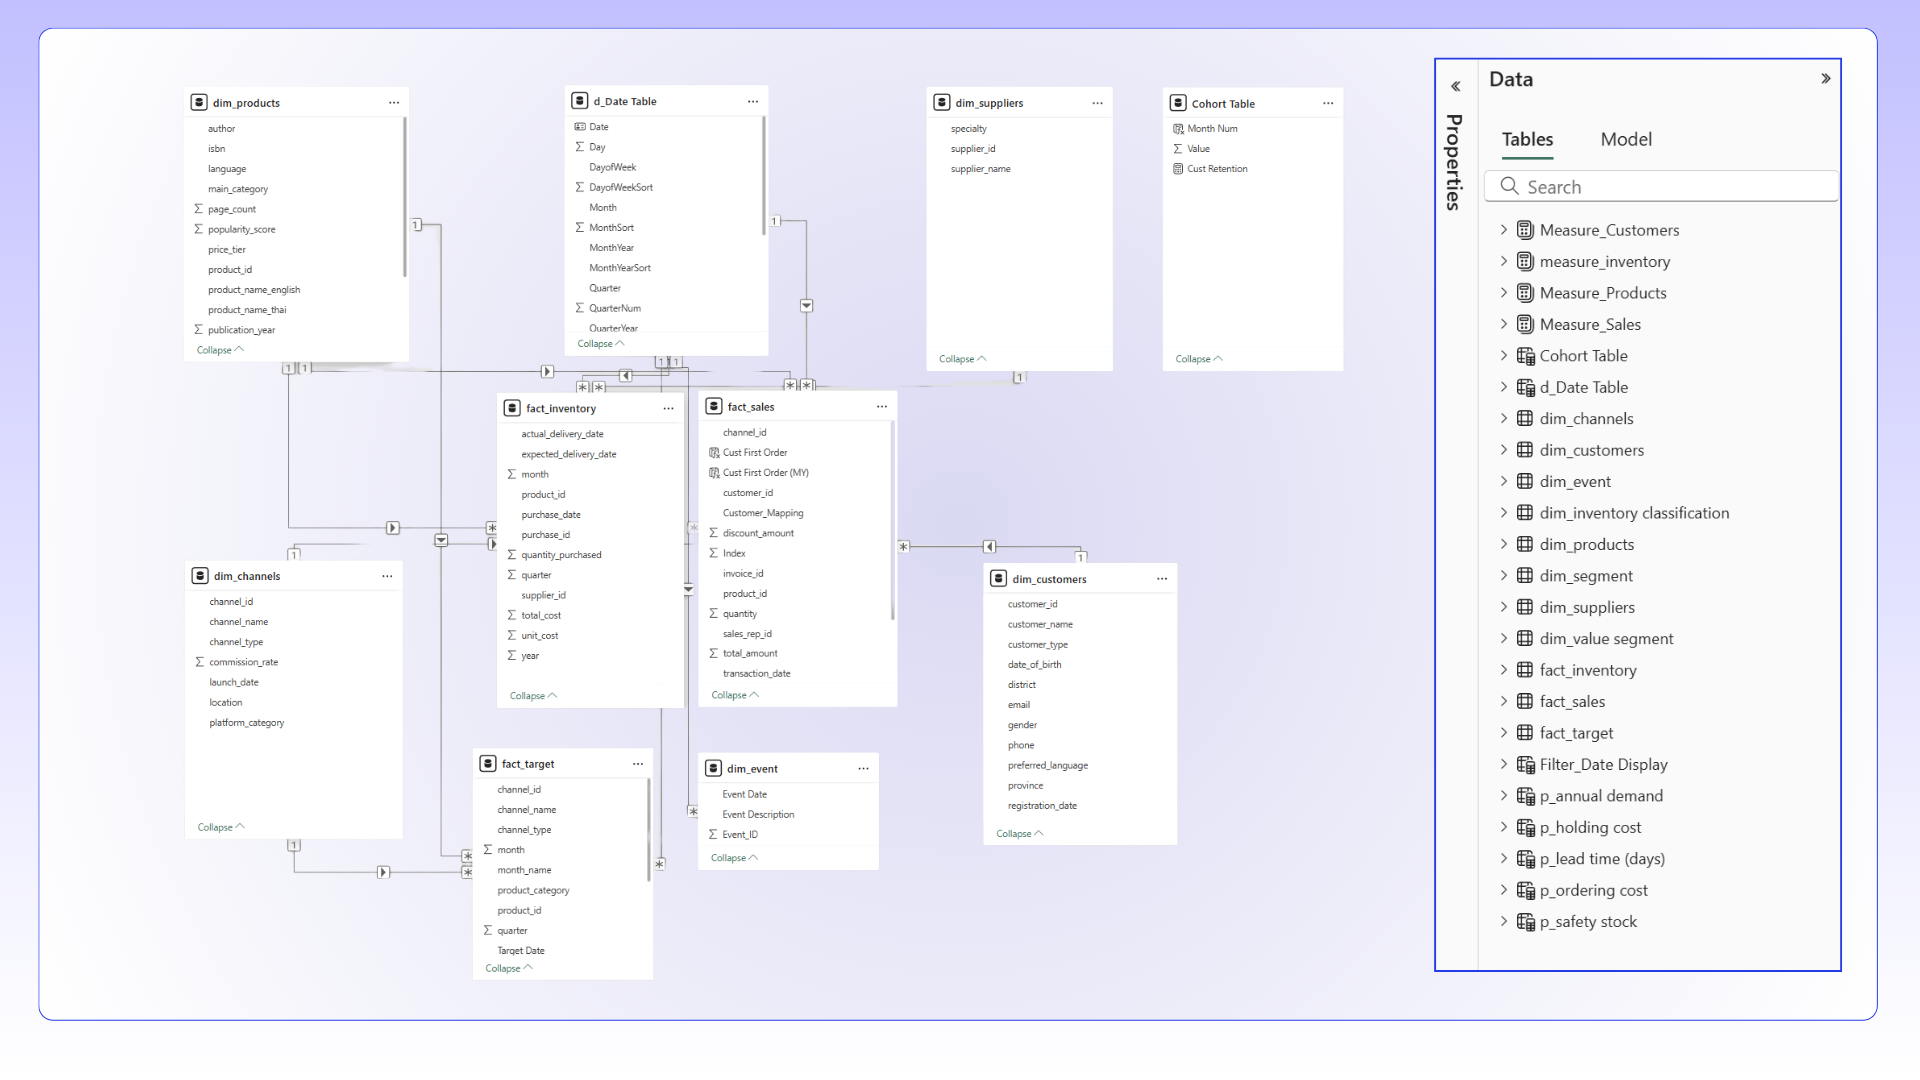
Step 3: Clean & Model Data
Power Query Transformation for Wisdom Bookstore:
Data Quality Challenges Addressed:
Invoice Logic Fix: Corrected transaction structure so multiple products in one purchase share the same invoice_id
Customer Mapping: Standardized customer identification across channels.
Date Standardization: Unified date formats across 5-year period (2019-2024)
Currency Normalization: Consistent Thai Baht formatting across all monetary fields
Category Harmonization: Standardized product category names across suppliers
Power Query Automation Benefits:
Time Savings: Reduced monthly data preparation.
Accuracy Improvement: Eliminated manual errors in invoice grouping and customer matching
Consistency: Automated data validation ensures reliable month-over-month comparisons.
Scalability: Handles 136K+ transaction records with optimized performance
Data Model
Step 4 & 5: Analyze Data & Share Results
Page1: Sales Overview Performance
👥 Primary Users & Usage Context
Manager - Strategic decision-making and board reporting
Sales Leadership - Performance management and resource allocation
Revenue Operations Team - Forecasting and planning
Business Intelligence Unit - Deep-dive analysis and trend identification
Usage patterns include daily morning reviews, weekly executive meetings, monthly board presentations, and quarterly strategic planning sessions.
🎯 Main Business Questions & Strategic Sub-Questions
Primary Strategic Question: "What is our current revenue trajectory and how can we optimize growth vectors?"
Supporting Analytical Questions:
What is our month-over-month growth momentum and underlying drivers?
Which product categories demonstrate highest sales and scalability?
How effectively are we monetizing our multi-channel strategy?
What is the customer segment value distribution and migration patterns?
📊 KPIs, Charts & Analytics Framework
Key Metrics:
Revenue Performance: Total sales, units sold, average transaction value (ATV), units per transaction (UPT)
Growth Indicators: Month-over-month changes, weekly trends, category mix
Customer Distribution: Segment performance (Regular/VIP/Corporate)
Strategic Insights:
Revenue Growth: THB 841,846 (+3.00% MoM) - Steady upward trajectory
Customer Quality: ATV THB 1,016.72 (+3.13%) - Premium customer behavior
Volume Efficiency: 2,399 units (-0.95%) with higher value per unit
Event Impact: 137% revenue boost during promotional weeks (W10/24, W13/24)
The Paradox of Growth: March 2024 reveals a fascinating pattern - while customer count dropped 2.36%, revenue increased 3%. Our customers are buying more per visit (ATV up 3.13% to ฿1,016), indicating we're attracting higher-quality buyers who find more value in our selection.
The Event Effect: Weeks 10 and 13 saw massive spikes coinciding with National Book Events. These two weeks alone generated 137% more revenue than typical weeks, proving that well-timed events are our golden ticket to revenue acceleration.
Category Winners: Business & Economics dominates at 36.84% of sales, followed by Education (20.7%). Interestingly, while Fiction ranks third in revenue, it shows the highest month-over-month growth at 4.05%, suggesting an emerging opportunity.
Strategic Recommendations:
Capitalize on Event Success: Increase promotional frequency which help stimulate sales
Convert Unidentified Customers: Implement aggressive loyalty program enrollment targeting the 28.08% unidentified segment, potentially adding 235,000 THB in trackable customer lifetime value
Premium Product Focus: Double down on Business & Economics and Education categories, which together drive 59.4% of revenue, by expanding premium offerings and exclusive titles
Customer Value Migration: Develop tiered loyalty programs to migrate Regular customers (58.24%) toward VIP status, leveraging the proven willingness to pay premium prices

Page2: Sales Channel Performance
👥 Primary Users & Usage Context
Channel Strategy Team - Channel optimization and investment decisions
Digital Transformation Office - Online/offline integration
Partnerships & Alliances - Third-party platform management
Marketing Operations - Channel-specific campaign optimization
🎯 Main Business Questions & Strategic Sub-Questions
Primary Strategic Question: "How do we optimize our omnichannel portfolio for maximum ROI?"
Supporting Analytical Questions:
Which channels demonstrate highest customer lifetime value?
What is the optimal channel mix for different customer segments?
How do we balance channel cannibalization vs. incrementality?
Where should we allocate marketing investment for maximum return?
📊 KPIs, Charts & Analytics Framework
Key Metrics:
Channel Performance: Revenue contribution, customer count, and ATV by platform
Channel Efficiency: Conversion rates and customer type distribution per channel
Geographic Performance: Sales by location and store comparison
Strategic Insights:
Digital Dominance: Top 3 online channels (Lazada, LINE Shopping, Website) generate ~70% of total sales
Target Achievement Variance: TikTok Shop at 49.97% vs. most online channels at 50-60%
Customer Acquisition Leaders: Lazada (161), LINE Shopping (159), Official Website (150)
Premium Channel Positioning: LINE Shopping ATV at 1,138.32 THB
The data reveals channels in different lifecycle stages. Lazada 59.93% target achievement in sales suggests either conservative target setting or explosive organic growth potential. This channel acquired 161 customers with an ATV of 1118.33, indicating strong customer quality.
The customer type distribution across channels reveals strategic positioning opportunities. VIP customers gravitate toward Lazada, Facebook shop and LINE Shopping, while Corporate customers prefertiktok shop and LINE Shopping. This segmentation suggests that different channels naturally attract different customer values, creating opportunities for targeted marketing and inventory allocation.
Physical locations show concerning trends, with traditional department stores and standalone locations significantly underperforming their digital counterparts. The data suggests customers have fundamentally shifted their purchasing behavior, preferring the convenience and selection of online platforms.
Strategic Recoomendations:
Lazada Acceleration: Immediately increase inventory allocation and marketing investment in TikTok Shop, given its 59.93% target achievement and strong customer acquisition (161 customers)
Premium Channel Strategy: Leverage LINE Shopping's high ATV (1,138.32) by positioning premium and exclusive products on this platform, targeting the affluent customer segment
Physical Store Rationalization: Evaluate the ROI of physical locations and consider converting underperforming stores to fulfillment centers or experience showrooms rather than traditional retail spaces
Channel-Specific Customer Development: Create targeted loyalty programs for each channel, recognizing that Lazada attracts VIP customers while the Website serves Corporate clients
Cross-Channel Integration: Develop omnichannel experiences that allow customers to research online and pick up in-store, leveraging the strengths of both digital and physical presence

Page3: Product Category Performance
👥 Primary Users & Usage Context
Category Management Team - Assortment planning and pricing
Procurement & Merchandising - Inventory investment decisions
Publishers Relations - Partnership negotiations
Pricing Strategy Committee - Dynamic pricing optimization
🎯 Main Business Questions & Strategic Sub-Questions
Primary Strategic Question: "How do we optimize our product portfolio for profitability and growth?"
Supporting Analytical Questions:
Which categories drive sustainable competitive advantage?
What is the optimal price tier distribution?
How do we balance bestsellers vs. long-tail inventory?
Which publisher partnerships generate highest returns?
📊 KPIs, Charts & Analytics Framework
Key Metrics:
Category Performance: Revenue and growth by book category
Price Tier Analysis: Premium vs Standard vs Budget mix
Publisher Concentration: Pareto analysis of supplier contribution
Strategic Insights
Wisdom Bookstore has positioned itself as a premium destination for professional and educational content, with Business & Economics (204,518) and Education & Academic (174,411) commanding 45% of total sales. The price tier analysis reveals a sophisticated customer base willing to pay premium prices, with 53.83% of sales coming from premium-tier products.
Category Leadership: Business & Economics (204,518, 24.3% share) dominates revenue
Premium Positioning: 53.83% of sales from premium-tier products vs. 44.69% standard
Publisher Concentration: Top 20% of publishers generate ~60% of revenue (Pareto principle)
Bestseller Impact: "Capital in the Twenty-First Century" exemplifies the intellectual positioning
The Pareto chart reveals publisher relationship dynamics that drive profitability. Publishers like Little, Brown and Company, Penguin Random House, and Crown Business represent strategic partnerships that should be nurtured and expanded. The long tail of smaller publishers, while providing variety, contributes minimally to revenue, suggesting opportunities for portfolio optimization.
Strategic Recommendation:
Publisher Partnership Expansion: Negotiate exclusive distribution agreements with top-performing publishers (Little, Brown and Company, Penguin Random House) to secure competitive advantages and better margins
Science & Technology Category Expansion: Given its standout performance within Business & Economics, create a dedicated Science & Technology section with expanded inventory and specialized marketing
Premium Tier Acceleration: Since 53.83% of sales come from premium products, actively phase out low-margin budget titles and focus on high-value, exclusive, and limited-edition publications
Cross-Category Bundling: Create intellectual journey packages that combine Business & Economics with complementary Fiction titles, leveraging the 167,821 Fiction revenue to enhance customer experience
Author Events and Exclusives: Partner with publishers to host author events and secure signed editions, particularly for bestsellers like "Capital in the Twenty-First Century," creating unique value propositions

Page4: Customer Insights & Segmentation
👥 Primary Users & Usage Context
Customer Experience Team - Engagement and retention strategies
CRM & Loyalty Management - Program design and optimization
Marketing Analytics - Segmentation and targeting
Customer Success Team - VIP and corporate account management
🎯 Main Business Questions & Strategic Sub-Questions
Primary Strategic Question: "How do we maximize customer lifetime value and retention?"
Supporting Analytical Questions:
What drives customer value migration between segments?
Which acquisition channels yield highest CLV customers?
What are early indicators of churn risk?
How do we optimize the customer journey for each segment?
📊 KPIs, Charts & Analytics Framework
Key Metrics:
Customer Health Score: 90.19% (Excellent status)
Value Segmentation: New Starters to VIP Elite distribution
Cohort Retention: Monthly acquisition and retention patterns
Customer Lifetime Value: Tenure and purchase behavior analysis
Strategic Insights:
Customer Health Excellence: 90.19% health score indicating exceptional engagement
Value Pyramid Balance: 473 New Starters → 201 Gold Members → 99 VIP Elite
Digital Acquisition Success: Lazada (81) and LINE Shopping (77) lead new customer acquisition
Tenure Value Correlation: Clear inflection point at 1,000 days (3 years) where customer value accelerates
With a Customer Health Score of 90.19% (Excellent status), Wisdom Bookstore has built a remarkably engaged customer base that defies typical retail patterns. The value segmentation reveals a healthy pyramid with 473 New Starters providing the foundation and 99 VIP Elite customers at the apex, but the real story lies in the 201 Gold Members who represent the sweet spot of customer development—high value, high engagement, and growth potential.
Customers who stay beyond 1,000 days (~ 3 years) show dramatic value acceleration, with CLV increasing 3-4x compared to newer customers. This suggests that Wisdom Bookstore creates genuine long-term relationships rather than transactional interactions. The cohort analysis supports this, showing strong retention patterns for customers acquired in January 2024 (30 customers still active in Month 11) and exceptional performance from the June 2024 cohort (32 customers active in Month 6).
The recency segmentation shows a healthy distribution with Active customers (0-90 days) maintaining high ATVs of 1,173, while even At Risk customers (181-270 days) demonstrate loyalty with 1,225 ATVs. This suggests that once customers engage with Wisdom Bookstore, they maintain high-value purchasing behavior even during dormant periods.
The acquisition channel analysis reveals that digital platforms not only drive volume but also quality, with Lazada and LINE Shopping customers showing strong progression through value segments. This validates the digital-first strategy while highlighting opportunities for channel-specific customer development programs.
Strategic Recommendations:
Three-Year Loyalty Milestone Program: Create special recognition and benefits for customers approaching the 1,000-day tenure mark, given the dramatic value acceleration at this point
Gold Member Optimization: Focus intensive development efforts on the 201 Gold Members, as they represent the optimal balance of value and growth potential, with targeted programs to accelerate their progression to VIP Elite status
Digital Acquisition Scaling: Double down on Lazada and LINE Shopping acquisition strategies, given their proven ability to attract high-quality customers who progress through value segments
Reactivation Excellence: Develop sophisticated win-back campaigns for At Risk and Dormant customers, leveraging their demonstrated high ATV potential (1,225 for At Risk segment)
Cohort-Based Onboarding: Analyze the success factors of high-performing cohorts (January and June 2024) to replicate their onboarding experiences for future customer acquisitions

Page5: Inventory Tracking
👥 Primary Users & Usage Context
Supply Chain Management - Inventory planning and optimization
Finance & Working Capital - Cash flow management
Procurement Team - Supplier negotiations and ordering
Operations Management - Warehouse and fulfillment optimization
🎯 Main Business Questions & Strategic Sub-Questions
Primary Strategic Question: "How do we optimize inventory investment while maintaining service levels?"
Supporting Analytical Questions:
What is the optimal stock level for each SKU?
Which products show signs of obsolescence risk?
How do we balance stockout costs vs. holding costs?
What is our true inventory turnover efficiency?
📊 KPIs, Charts & Analytics Framework
Key Metrics:
Inventory Efficiency: EOQ, ROP, stock days coverage
Stock Health: Dead stock identification, ABC classification
Inventory Turnover: how fast each product SKU is sold
Supply Chain Metrics: Lead time, safety stock levels
Strategic Insights:
Inventory Efficiency: 37.82% sell-through rate with 12.39 days stock coverage
Turnover Performance: 0.07-0.09 range across products (below optimal)
Seasonal Patterns: Clear quarterly peaks requiring dynamic inventory adjustment
The inventory analysis reveals a business caught between growth ambitions and operational efficiency. With an EOQ of 44.70 units and ROP of 2,682.25 units for key products, Wisdom Bookstore operates with sophisticated inventory planning, yet the 37.82% sell-through rate and 12.39 days of stock coverage suggest room for optimization. The seasonal volatility shown in the sales trends chart—with peaks in April, July, and October—indicates predictable patterns that aren't fully leveraged in inventory planning.
The inventory turnover rates of 0.07-0.09 tell a story of conservative inventory management that prioritizes availability over efficiency. While this ensures customer satisfaction and prevents stockouts, it ties up significant working capital that could be deployed more strategically. The 37.82% sell-through rate, while respectable, suggests that inventory levels could be optimized to improve cash flow without compromising service levels.
The seasonal trend analysis reveals predictable quarterly patterns with significant volatility (2K unit swings), yet the current inventory model appears to use static rather than dynamic parameters. The April, July, and October peaks represent opportunities for strategic inventory builds, while the valleys suggest periods for inventory reduction and cash flow optimization.
Strategic Recommendations:
Dynamic Seasonal Planning: Implement quarterly inventory models that build stock 30 days before historical peaks (March for April peak, June for July peak, September for October peak) and reduce inventory during predictable valleys
Sell-Through Optimization: Target 50-55% sell-through rates by reducing initial order quantities by 15-20% and implementing faster reorder cycles.
Turnover Acceleration: Implement promotional strategies during slow periods to achieve 0.12-0.15 turnover rates, using the freed capital to expand high-performing categories like Science & Technology
Predictive Inventory Management: Leverage the clear seasonal patterns to implement AI-driven demand forecasting that adjusts EOQ and ROP parameters monthly rather than using static calculations
Cash Flow Optimization: Use the 12.39 days coverage data to implement just-in-time ordering for predictable titles while maintaining safety stock only for bestsellers and new releases

Page6: Salesperson Performance
👥 Primary Users & Usage Context
Sales Management - Performance management and coaching
Human Resources - Compensation and incentive design
Training & Development - Skill gap identification
Sales Operations - Territory and quota planning
🎯 Main Business Questions & Strategic Sub-Questions
Primary Strategic Question: "How do we maximize sales force productivity and effectiveness?"
Supporting Analytical Questions:
Which sales representatives consistently outperform and why?
What is the optimal customer-to-rep allocation?
How do we identify and replicate best practices?
What drives variance in individual performance?
📊 KPIs, Charts & Analytics Framework
Key Metrics:
Individual Performance: Revenue, customer count, and portfolio quality by rep
Category Specialization: Which reps excel in which categories
Customer Segment Management: Value segment distribution by rep
Activity Metrics: New customer acquisition and retention rates
Strategic Insight:
Performance Range: 8,212 THB (REP004) to 1,909 THB (REP016) - 4.3x variation
Specialization Success: REP007 excels in International Fiction, Gold Members (2,914 THB)
Location Sensitivity: REP007 - +5.85% at Lotus vs. -63.74% at Standalone Store - Siam
Customer Segment Effectiveness: REP007 - Strong performance with Gold (2,914 THB) and Bronze (2,384 THB) members
The performance distribution suggests a sales team in transition, with clear top performers (REP004, REP001, REP014) who have found their optimal combination of products, locations, and customers. REP007's detailed analysis provides a blueprint for optimization: exceptional performance with Gold Members (2,914 THB) and Bronze Members (2,384 THB), strong results at Lotus (+5.85%), and category expertise in International Fiction.
The location performance variance is particularly telling—REP007's 69-point swing from +5.85% at Lotus to -63.74% at Standalone Store - Siam suggests that environmental factors, customer demographics, or operational support vary dramatically across locations. This isn't a training issue; it's a strategic alignment opportunity.
The customer segment analysis reveals that successful representatives understand their customer base. REP007's strength with Gold and Bronze members, combined with moderate performance with Active customers (1,204 THB) and surprising success with Dormant customers (1,222 THB), suggests sophisticated relationship management skills that could be replicated across the team.
Strategic Recommendations:
Specialization Strategy: Assign representatives to categories and customer segments where they demonstrate natural affinity—REP007 should focus exclusively on International Fiction and Gold/Bronze member development
Location Optimization: Reallocate territories based on performance data—move REP007 from underperforming locations to Lotus and similar high-performance venues, while identifying representatives who excel in challenging locations
Performance Acceleration Program: Pair bottom quartile performers (REP016, REP019, REP020) with top performers for mentoring, focusing on replicating successful approaches to customer segment management
Customer Lifecycle Specialization: Leverage REP007's success with Dormant customers (1,222 THB) by creating a specialized reactivation role, potentially recovering significant revenue from the customer base
Territory Redesign: Use the performance data to create territories that maximize each representative's strengths while ensuring adequate coverage of all customer segments and locations
